Ordering the filters in a de novo nanobody pipeline
NanoDeNovo starts from the antigen alone, the VP3 capsid protein of poliovirus type 1, Sabin strain. No immunisation, no display library, no starting binder. The design work is in what each filter costs and where it belongs in the sequence.
Five stages and their cost ratio
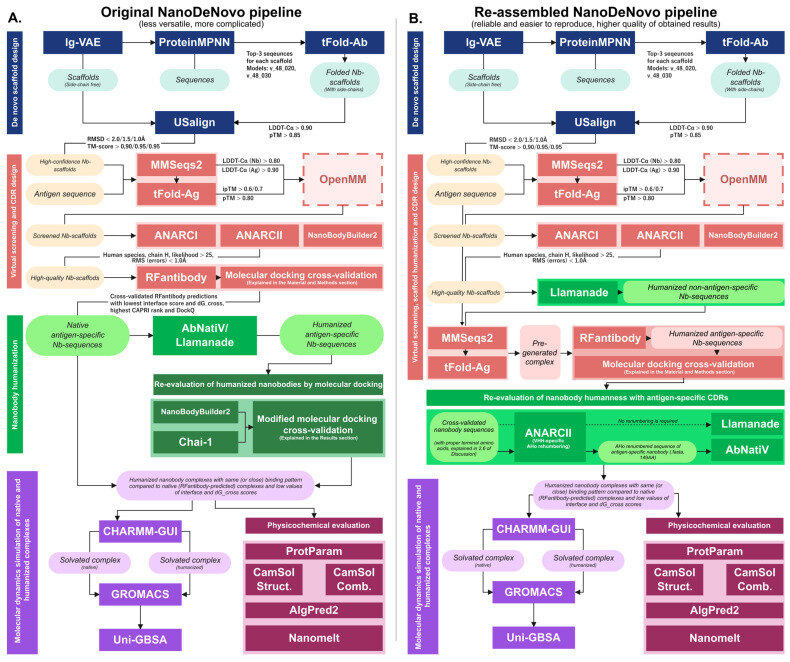
The pipeline runs scaffold sampling, folding, complex prediction, CDR loop redesign and humanisation. Per-candidate cost rises by roughly three orders of magnitude from folding to Rosetta relaxation with interface scoring, which fixes the filter order: the cheapest discriminating test runs first, and each stage exists to reduce the population entering the next.
- Scaffold sampling. Generate nanobody structures and sequences. Two weight-model groups run in parallel throughout, so we could check each threshold against a second population before fixing it.
- Folding. Fold the sampled sequences and filter on per-residue confidence and predicted fold accuracy. This removes sequences that are legal outputs of the sampler and do not describe a producible immunoglobulin fold.
- Complex prediction. Predict the antigen complex and filter on interface confidence at a threshold of 0.7.
- Loop redesign. Redesign CDR H1 to H3 on the survivors, relax, and score the interface with Rosetta.
- Humanisation. Convert the framework, then re-fold and re-dock before accepting the result.
Where the interface-confidence cut goes
The 0.7 cut on interface confidence governs throughput for the whole run. It splits the folded pool into a plausible minority and a majority that would consume relaxation time without producing a usable interface score.
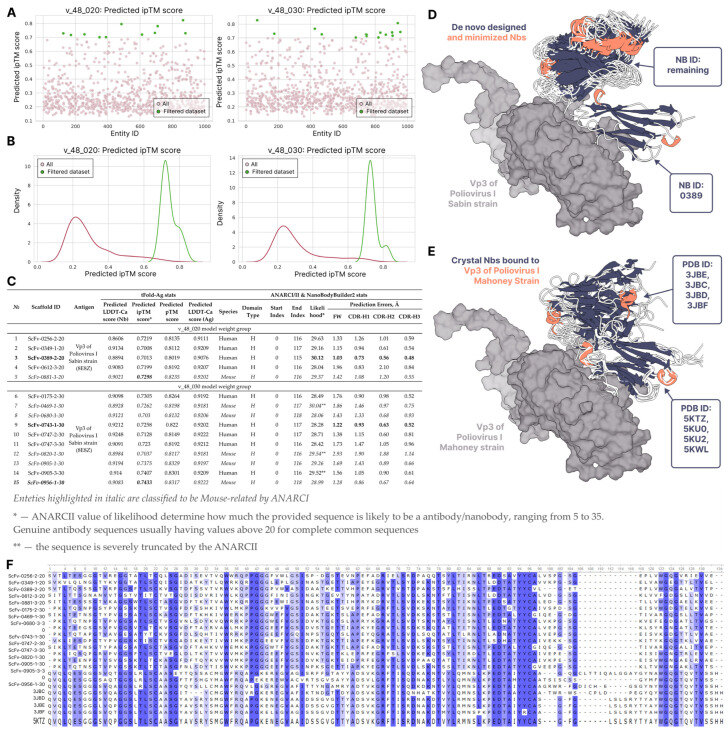
Two practical points about setting it. Raising the cut past 0.7 shrinks the pool faster than it improves the surviving interface scores, so the gain in mean quality costs candidate diversity that later redesign cannot restore. Lowering it below 0.6 admits complexes whose predicted interfaces move between random seeds, which shows up as high variance in the relaxed score, with no visible failure at the prediction step. Run the threshold sweep on the second weight-model group before committing to a value.
Correlated proxies
A cascade of five filters passes candidates that survived five imperfect tests. When the tests correlate, the survivor set is narrower than the score suggests and biased toward one kind of solution. The mitigation used here assigns each stage a distinct question: does the sequence fold, does a binding mode exist, is the interface energetically reasonable after relaxation, is the framework human enough to develop. Errors in those four are less likely to align than errors in four variants of the same confidence metric.
Report the distribution at each stage, not only the number of survivors. If a stage removes most of its input and the next stage's metric distribution does not move, that stage is filtering on something the next one already covers.
Reading the redesign result
Loop redesign improves interface scores by construction, so the score change alone says little. The useful comparison is residue-level: which epitope contacts appear in the native complexes and persist across the top-scored redesigned set, and which appear in single solutions.
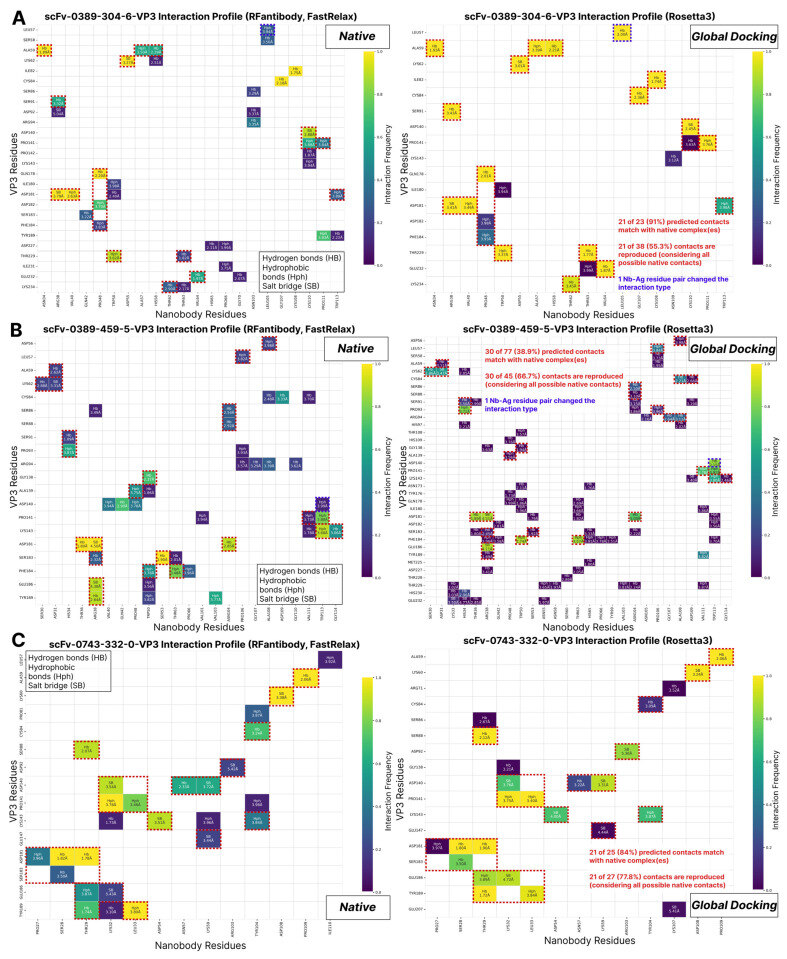
Use the recurring contacts as constraints for the next redesign round. On their own they are not a result. Positions appearing in one solution and absent from the rest describe that solution's geometry and give no evidence about the epitope.
Humanisation belongs inside the loop
Placing humanisation last is the natural pipeline order and it produces a measurable problem. Framework substitutions change the scaffold that supports the CDR loops, so a humanised sequence has to be re-folded and re-docked. It does not inherit the properties of the molecule it came from. Running the nativeness profile before and after quantified the shift and led to the re-assembled variant shown in the first figure, where redesign runs on the humanised scaffold.
The practical version: humanise the scaffold set first, re-fold, then redesign loops on the humanised frameworks. That order costs more folding calls and removes a class of candidate that scores well before humanisation and fails after it.
The cascade, as thresholds
Each stage has one gate and one recorded distribution. Writing them in one place makes it visible when two gates measure the same property:
GATES = [
    # stage           metric                 keep if      records
    ("fold",          "lddt_ca",             ">= 0.80",   "per-residue confidence"),
    ("fold",          "ptm",                 ">= 0.70",   "predicted fold accuracy"),
    ("complex",       "iptm",                ">= 0.70",   "interface confidence"),
    ("redesign",      "rosetta_interface",   "top 100",   "interface score after relax"),
    ("humanise",      "nativeness",          "profile",   "before and after, same scaffold"),
]

def survives(candidate):
    return (candidate.lddt_ca >= 0.80
            and candidate.ptm >= 0.70
            and candidate.iptm >= 0.70)

# Re-fold and re-dock after humanisation. Framework substitutions change the
# scaffold that supports the loops, so nothing transfers untested.
def humanise_then_verify(candidate):
    humanised = humanise(candidate)
    humanised = fold(humanised)
    humanised = dock(humanised, antigen)
    return humanised if survives(humanised) else None
Stack
- Folding
- tFold-Ab for antibody-specific folding; AlphaFold-Multimer and AlphaFold3 for complexes
- Sequence design
- ProteinMPNN for scaffold sequences; RFantibody for CDR loop redesign
- Refinement
- Rosetta FastRelax, then interface scoring for the ranking pass
- Humanisation
- AbNatiV nativeness profiles, computed before and after conversion
- Developability
- ProtParam, NanoMelt, CamSol, AlgPred2
- Dynamics
- GROMACS with CHARMM36; CHARMM-GUI for system preparation; Uni-GBSA and gmx_MMPBSA for binding free energy
- Target
- Poliovirus type 1 VP3 capsid protein, Sabin strain
Status of the output
The pipeline produces a ranked set of sequences with structural rationale attached. Expression, binding and specificity require the corresponding assays, and the records needed to make those assays interpretable are covered in a separate note.
Full method and results: Kotelnikov D. D., Tatarinova K. S., Zhdanov D. D. NanoDeNovo: de novo design of anti-poliovirus I Sabin strain nanobodies by semi-automated computational pipeline. International Journal of Molecular Sciences, 2025, 26(19), 9262.
References
- Jumper J. et al. Highly accurate protein structure prediction with AlphaFold. doi:10.1038/s41586-021-03819-2
- Evans R. et al. Protein complex prediction with AlphaFold-Multimer. doi:10.1101/2021.10.04.463034
- Dauparas J. et al. Robust deep learning-based protein sequence design using ProteinMPNN. doi:10.1126/science.add2187
- Bennett N. R. et al. Atomically accurate de novo design of antibodies with RFdiffusion. doi:10.1101/2024.03.14.585103
- Ramon A. et al. AbNatiV: VQ-VAE-based assessment of antibody and nanobody nativeness. doi:10.1038/s42256-023-00778-3
- Sormanni P. et al. The CamSol method of rational design of protein mutants with enhanced solubility. doi:10.1016/j.jmb.2014.09.026
- Alford R. F. et al. The Rosetta all-atom energy function for macromolecular modeling and design. doi:10.1021/acs.jctc.7b00125